
Capital Is Coming
The 17-to-1 gap is where capital still has to travel.

Note to readers: This piece is marked as subscriber content. Until The Gold Grid’s paid tier launches on August 3, 2026, all pieces publish free to everyone. After that date, subscriber-only pieces like this one will be gated.
In January 2026, investors poured a record $19 billion into gold ETFs in a single month.
In the same period, the VanEck Junior Gold Miners ETF — the most heavily-traded equity proxy for sub-tier gold companies — recorded net outflows.
The capital is arriving. The capital is not arriving in the same place.
That is the paradox at the center of Signal 6.
What the flood looks like
The bullion tier has been re-rated by macro money. Total assets in physically-backed gold ETFs reached $669 billion in February 2026. The SPDR Gold Shares — the world’s largest physically-backed gold fund — passed $180 billion on its own.
In a single February week, bitcoin ETFs bled $4.3 billion as institutional money rotated out of “digital gold” and back into the actual metal. Central bank buying has held at multi-year highs through 2024 and 2025. The macro flow into gold is no longer in question. It has happened. It is happening. And the structural drivers — de-dollarization, sovereign debt overhang, central bank reserve diversification — are not reversing.
But the flood has a shape.
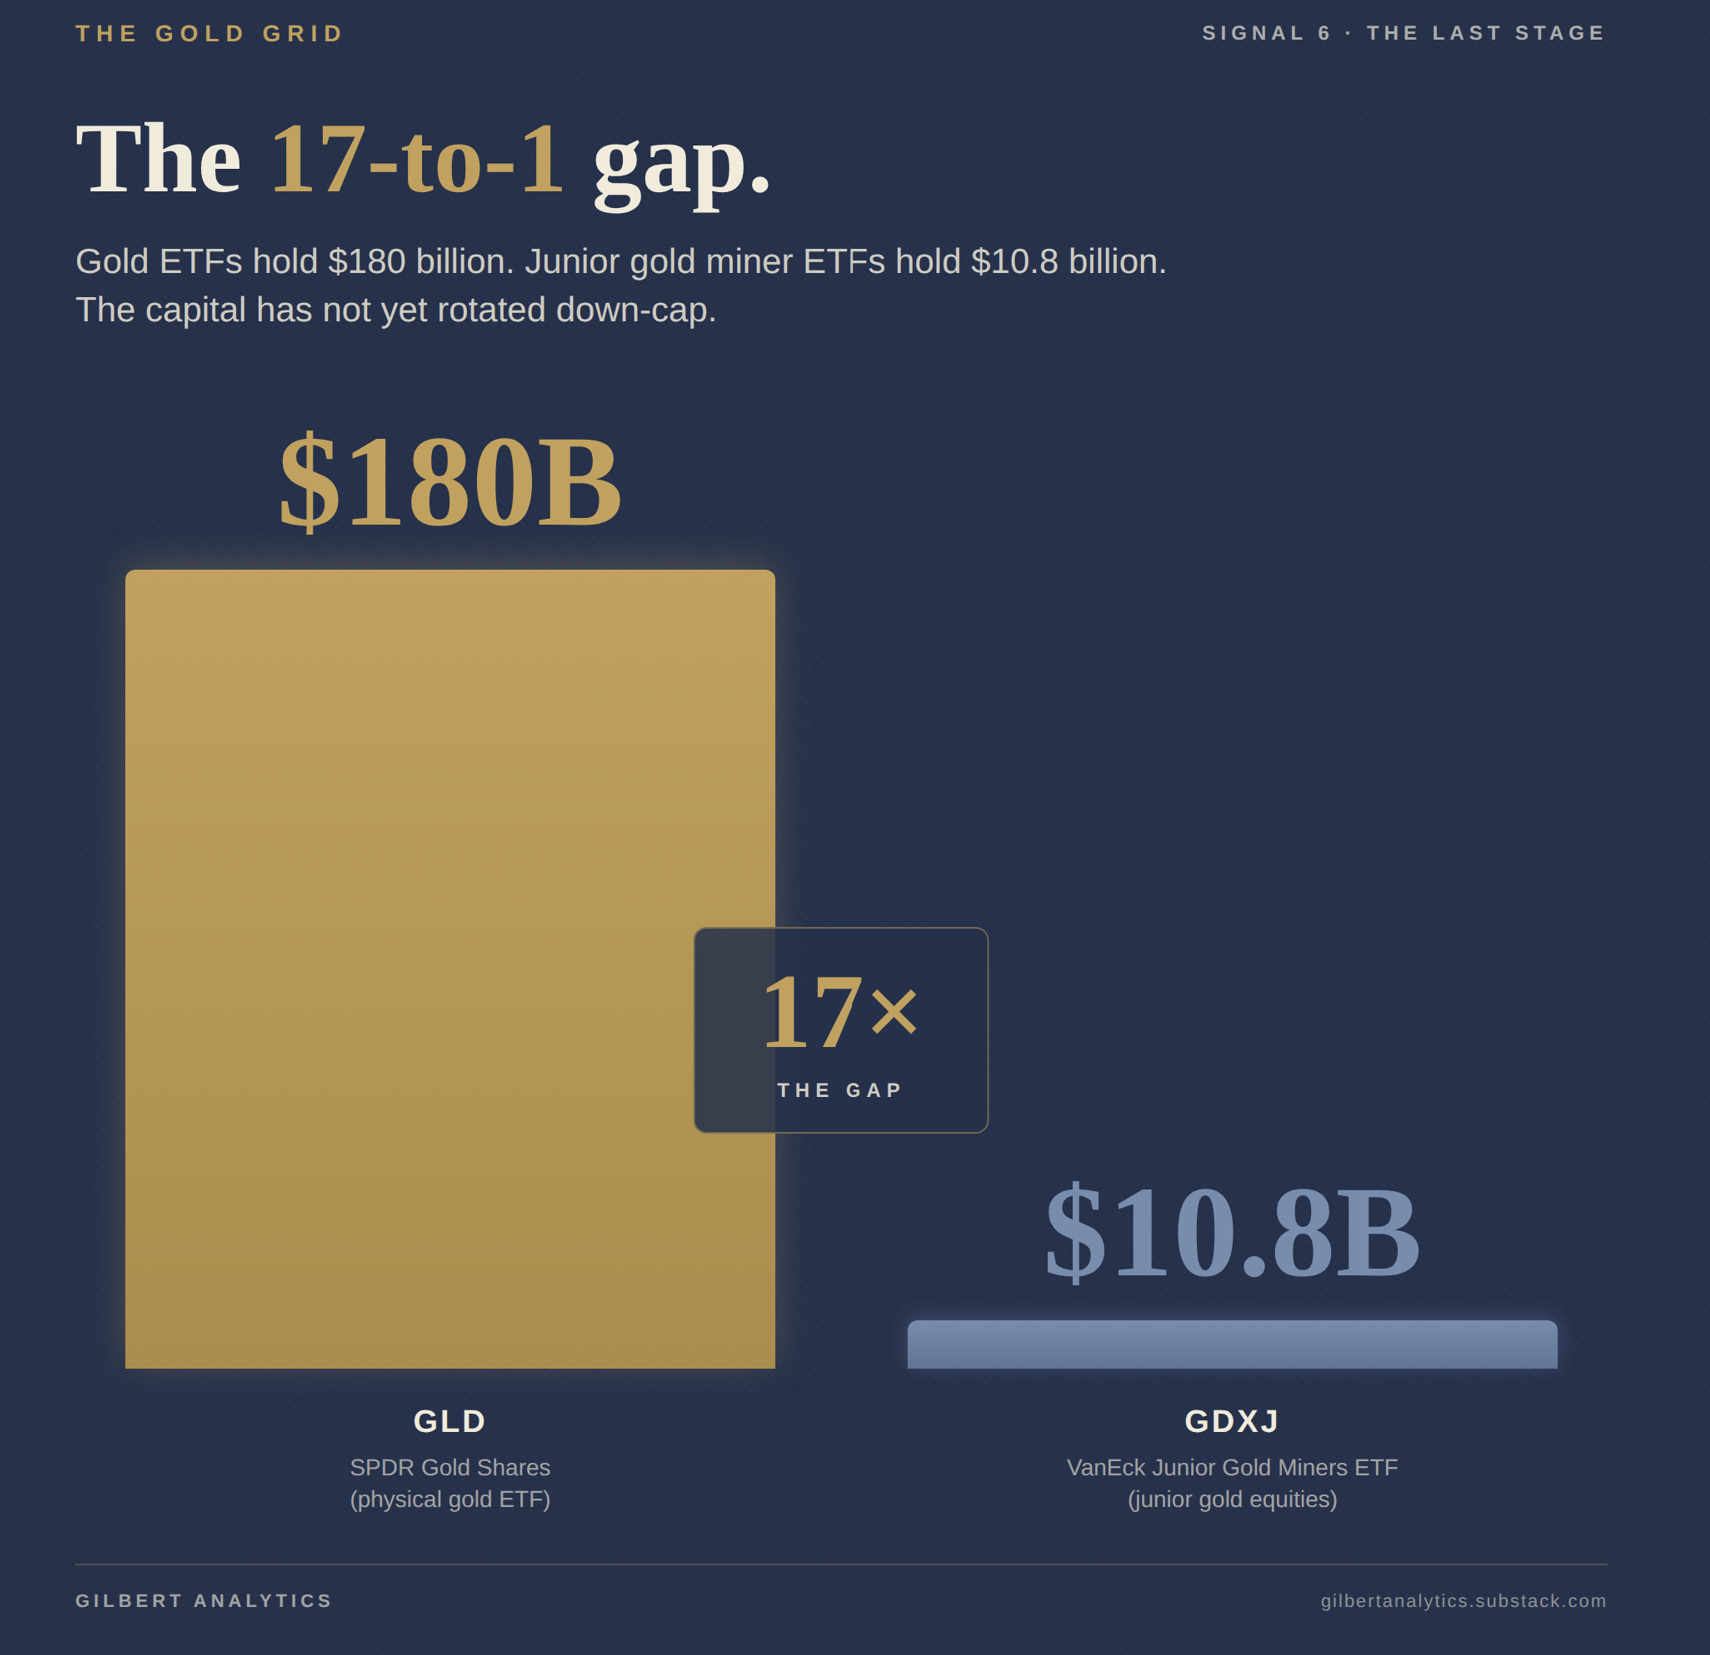
The 17-to-1 gap
Here is the number that should change how you read the rest of this cycle.
Gold ETF assets under management (GLD): $180 billion.
Junior gold miner ETF assets under management (GDXJ): $10.8 billion.
Seventeen to one.
A gap between these two funds is not new. GDXJ has always been the smaller cousin — the GLD:GDXJ ratio has ranged roughly between 8-to-1 and 15-to-1 over the fund’s sixteen-year history. What is new is that the gap has widened in 2025–2026, not narrowed.
The structural data tells the story most clearly. Over the past ten years, GLD has attracted +$22 billion in net new capital while GDXJ has shed roughly $322 million. A full decade of bullion accumulation against a full decade of net withdrawal from the junior equity tier. The gap is not just a current snapshot — it is a directional divergence that has been compounding.
And the GDXJ number is more interesting than it looks. Between the end of April 2025 and the end of April 2026, GDXJ delivered a +89.5% price return — the unit price rose from $61.40 to $116.34. You might assume new investors poured in to chase that performance.
They did the opposite.
Over those same twelve months, GDXJ recorded net outflows of approximately $1.33 billion. In prior cycles, junior gold rallies pulled retail capital into GDXJ — flows turned positive when miners ran. This cycle, they have not. Yet.
A quick clarification on the terminology, because this is the load-bearing distinction in Signal 6:
AUM = Assets Under Management. It is the total dollar value of what a fund holds. AUM rises in two different ways — when the holdings appreciate in price, and when new investors put fresh capital into the fund. Net flows separate the two. They measure only the second.
The GDXJ data says: price did the work. Investors did not. Despite a near-doubling of the equity tier over twelve months, more money has been withdrawn from GDXJ than added. The retail rotation from bullion into junior gold equities — the trade most analysts assume “should happen next” — has not started.
Where capital IS arriving
That does not mean juniors are starved everywhere. The financing window has opened.
Junior and intermediate mining companies raised $21.43 billion in 2025 — more than doubling 2024 and posting the second-highest annual total in S&P Global’s records. October 2025 alone saw $3.59 billion raised across the junior+intermediate tier, with gold financings hitting an all-time monthly record of $1.75 billion — the highest single month in S&P’s dataset back to January 2014.
The capital is arriving. But look at where it lands.
In 2025, minesite exploration — spending around existing mines, expanding known orebodies — hit a record-high 45% of global exploration budgets. Grassroots exploration — the discovery work that creates new pre-resource projects — fell to a record-low 21%.
Capital is finding the producers, the developers with funded mine plans, and the late-stage juniors approaching feasibility. Pre-43-101 explorers — those that have not yet declared a maiden Mineral Resource Estimate — are still being passed over.
That is the bottom rung. That is where the gap is still wide.
What closes it
Signal 5 established the floor that prevents acquisition prices from falling — set by replacement cost, which has become functionally unattainable on producer timelines. Signal 6 names where capital still has to travel before that floor lifts the trading range with it.
Two paths close the gap.
Path 1: retail rotation arrives. The 17-to-1 ratio does not have to hold. Capital that floods bullion eventually flows down-cap — into seniors, then into developers, then into discovery-tier juniors — once the easy gains higher up are recognized. GDXJ flows are the cleanest leading indicator. When they turn positive and stay positive, the rotation has begun.
Path 2: acquirer firepower deploys at the bottom rung. Precious metals companies raised $14.5 billion in capital markets in 2025 — more than three times the $4.6 billion raised in 2024. Mining M&A in early 2026 ran at an eleven-year high, roughly 80% gold and silver by deal value. The acquirers have ammunition. They will eventually have to deploy it against the replacement-cost floor — and the targets that fit that floor sit in the discovery tier.
The Gold Gap is the metric that flashes when either path arrives. It compresses when trading prices rise toward what acquirers pay — whether because retail bid the equities up, or because acquirers came down to buy at the floor.
Right now, the Gold Gap is at approximately 87% compression — measured against the $5,000 screening price the Gold Grid uses as its long-cycle anchor.
The capital is coming. The floor is rising. The question is which path closes the gap first.
The full Gold Grid — every scored company, every band, every Gap Benchmark position — opens to Founding Members on August 3, 2026. One hundred seats. The framework is free. The companies behind it are for subscribers.
The Last Stage so far
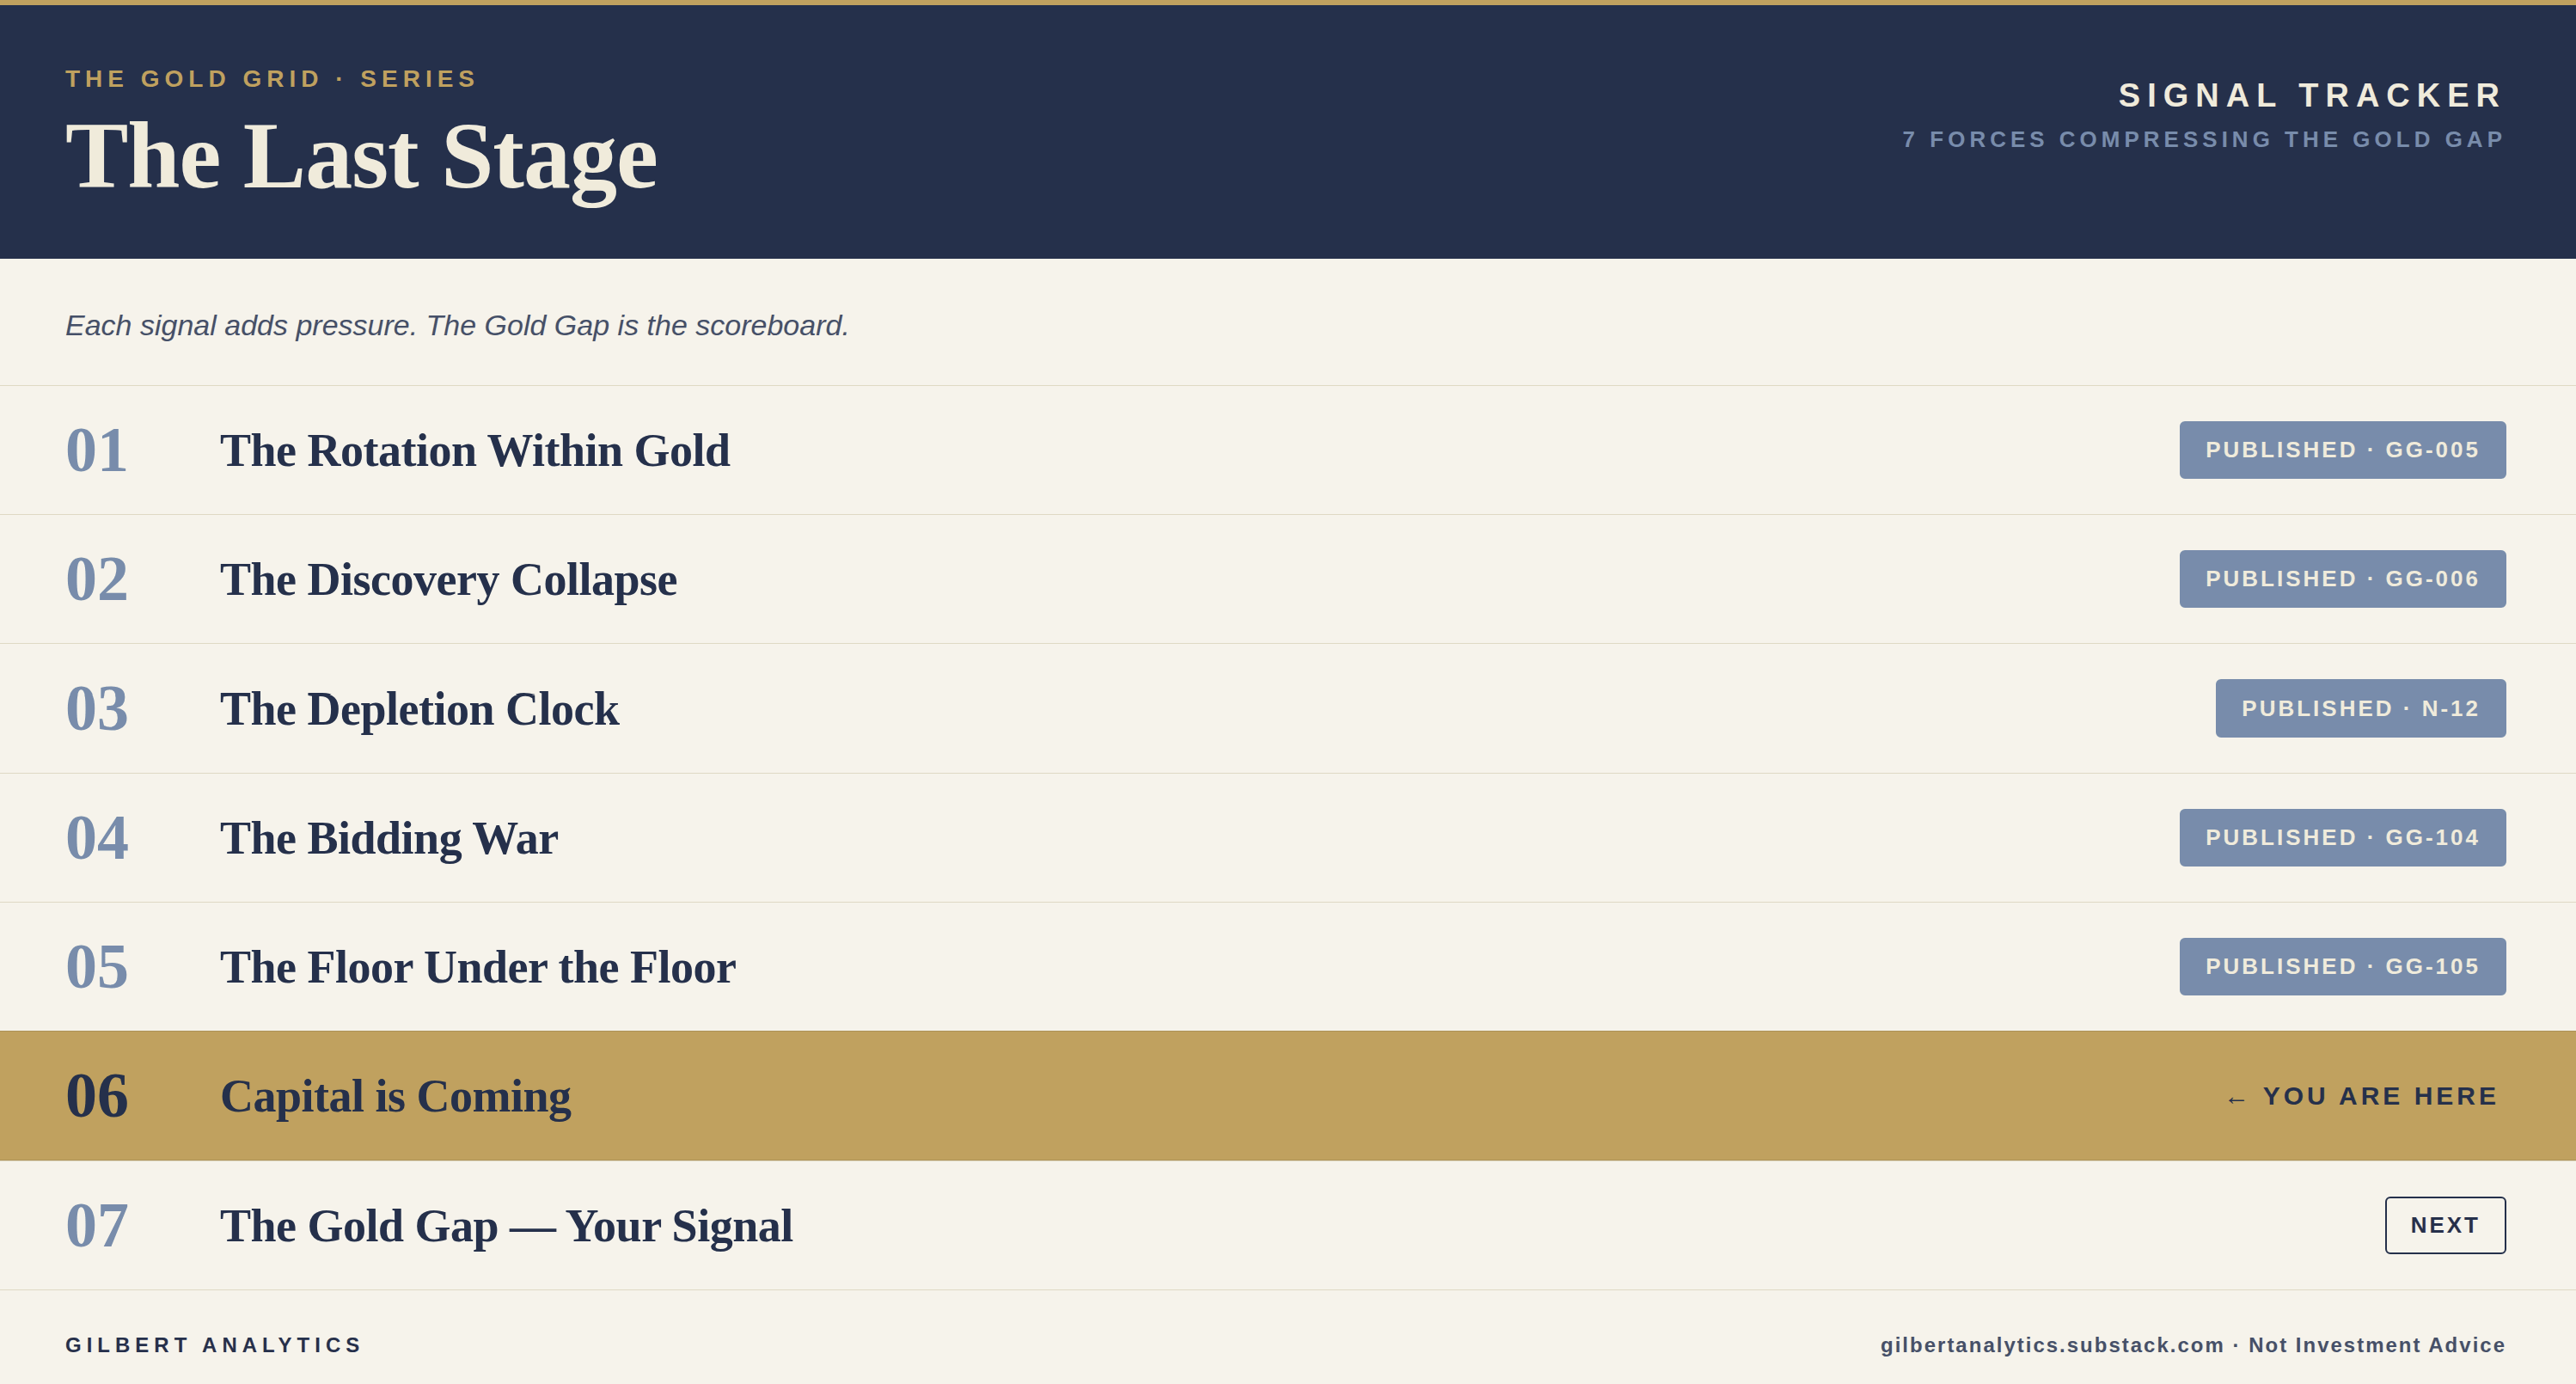
All available at gilbertanalytics.substack.com.
Next signal
Signal 6 names where capital still has to travel. Signal 7 — The Gold Gap — Your Signal — closes the series: how Signals 1 through 6 combine into the entry window the Grid was built to identify.
Signal 7 publishes Tuesday May 19.
Which path do you think arrives first — retail rotation into junior gold equities, or acquirer firepower at the bottom rung?
The Gold Grid ranks a curated set of junior gold explorers on what acquirers actually look for. Founding Member access opens August 3 — 100 seats.
gilbertanalytics.substack.com
Alain Gilbert, B.Eng. is the founder of Gilbert Analytics and author of The Gold Grid — independent, engineering-grade analysis of junior gold M&A. Full publication for investors at gilbertanalytics.substack.com. Research and methodology for CEOs and corporate development teams at gilbertanalytics.com.
This analysis does not constitute investment advice. The author holds positions in publicly traded junior gold companies.
Gilbert Analytics produces independent analysis of the junior gold mining sector. New to The Gold Grid? Start with Mind the Gold Gap (the framework) and What Acquirers Pay (the methodology) at gilbertanalytics.substack.com.
The Gold Gap Index is a macro indicator based on publicly available M&A transaction data. It does not constitute investment advice.
All figures USD unless otherwise noted.
Disclosure
The author, Alain Gilbert, holds positions in publicly traded junior gold companies. The author may also hold positions in other publicly traded companies discussed in this publication. All material positions are disclosed when relevant. This analysis does not constitute individual investment advice and is not designed to meet your personal financial situation or needs. The author is not a licensed financial analyst, registered broker-dealer, or investment adviser, and is not registered with the U.S. Securities and Exchange Commission, any state securities regulatory authority, or any self-regulatory organization. Never make an investment based solely on what you read in an online newsletter.
Results Not Typical. Any historical performance data published by Gilbert Analytics, including the Gap Benchmark, reflects past market outcomes and is not indicative of future results. Gilbert Analytics does not track or verify subscriber trading results. Actual outcomes will vary widely based on individual decisions, risk tolerance, experience, and market conditions. Investing in junior mining companies is speculative and carries a high degree of risk. You may lose some, all, or possibly more than your original investment. You are solely responsible for your own investment decisions. Always consult a licensed or registered financial professional before making any investment decision.
Alain Gilbert, B.Eng., is the founder of Gilbert Analytics.
Full disclosures at gilbertanalytics.substack.com/about