
Gold Gap Snapshot — March 2026
Gold crossed $5,000. The Gap just hit $621/oz.

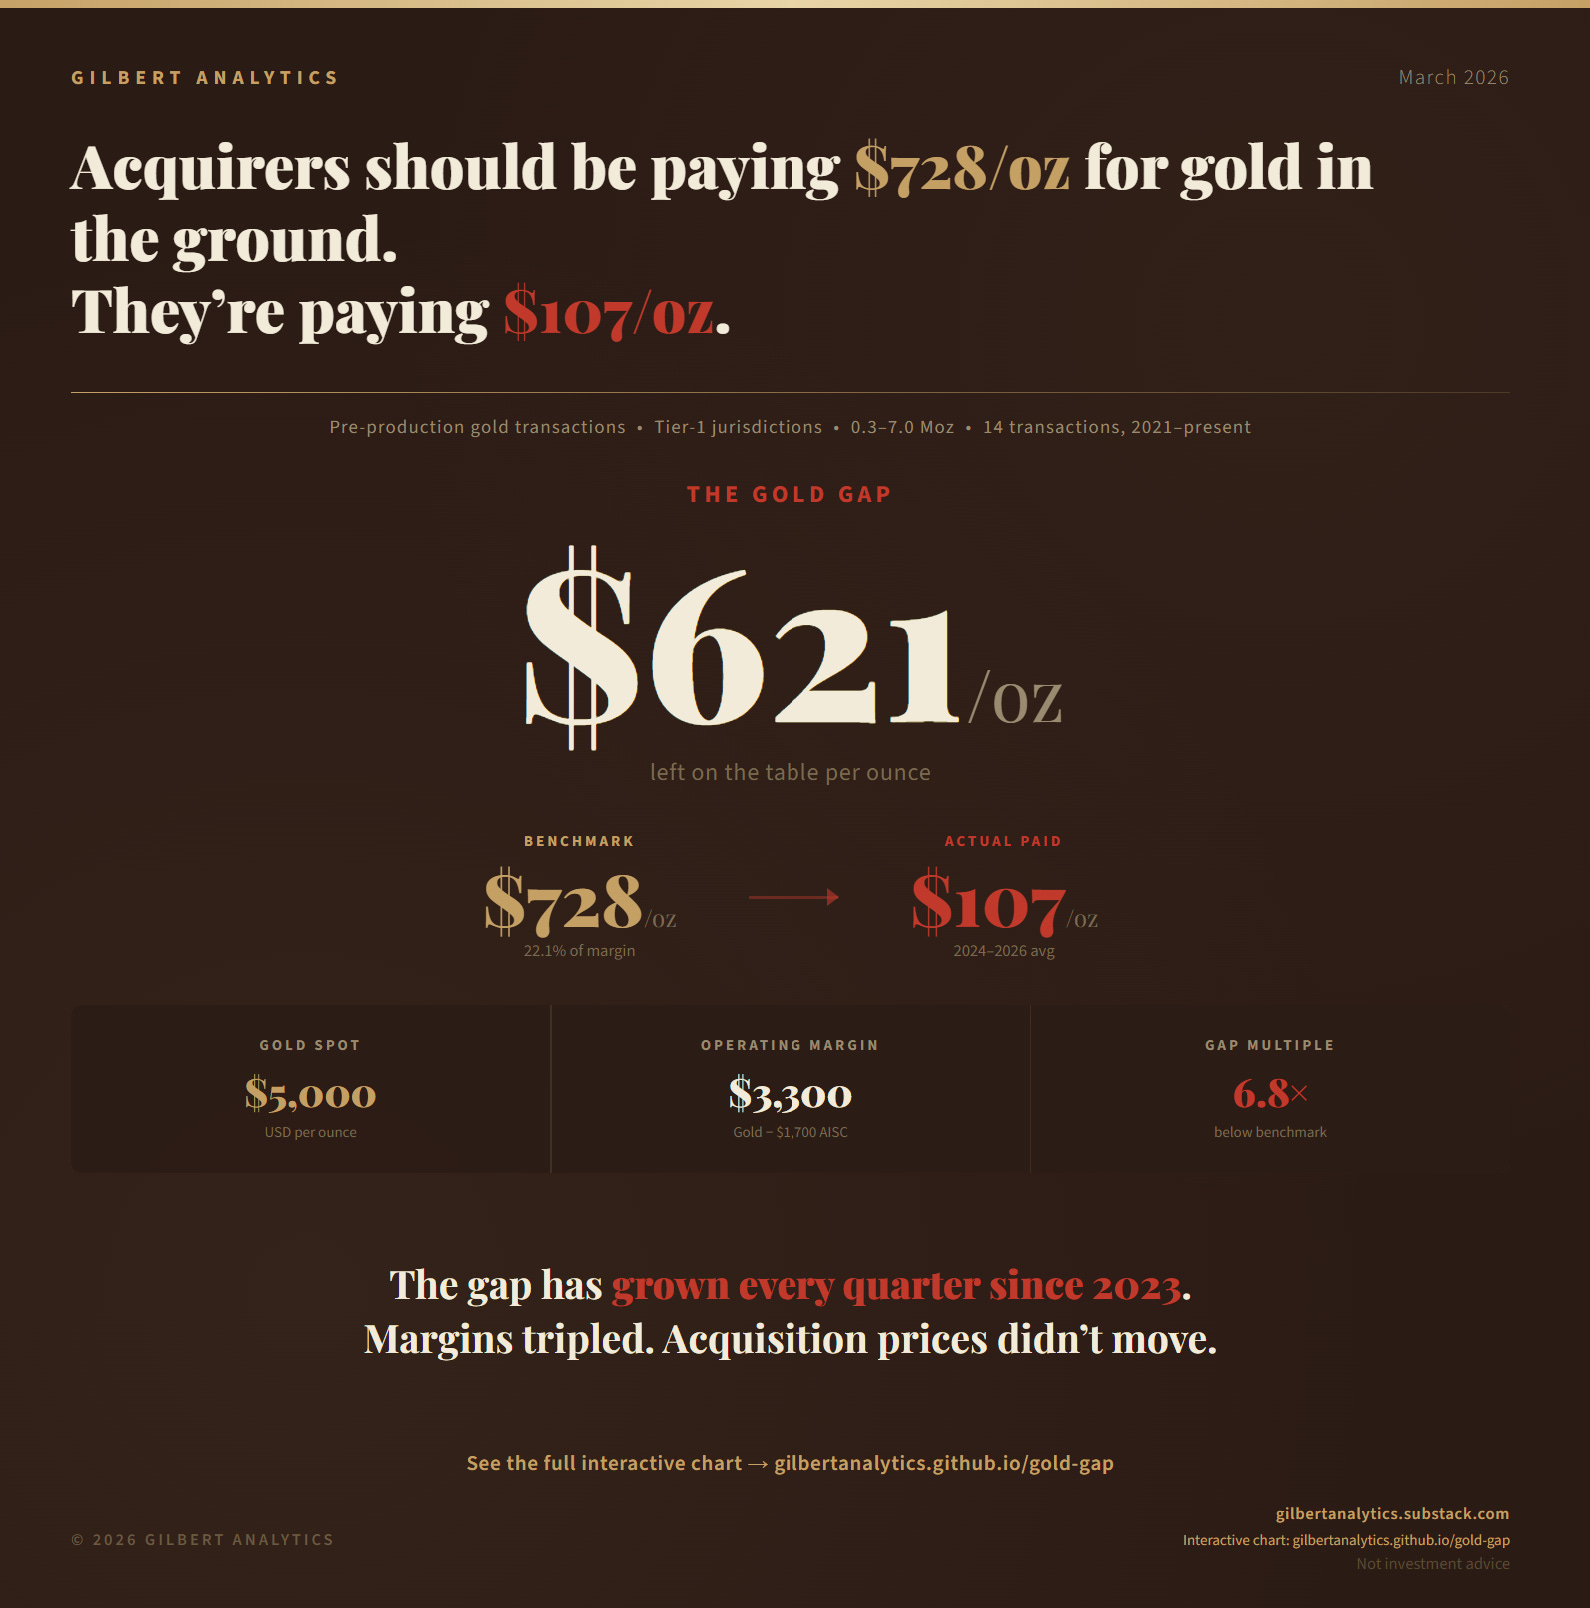
Gold is above $5,000 per ounce. Operating margins for a hypothetical producer are now $3,300/oz — the widest in history.
And yet, acquirers are still paying roughly $107/oz for pre-production gold in the ground.
If historical M&A premiums held at their Core average of 22.1% of operating margin, acquirers should be paying $728/oz. The difference — $621 per ounce — is the Gold Gap, and it has grown every quarter since 2023.
What’s new this month: We’ve added a scope line directly on the snapshot. After some great questions from readers and LinkedIn contacts, we want to make sure the data speaks for itself without ambiguity. The Gold Gap Index tracks pre-production gold transactions only — exploration through feasibility — in Tier-1 jurisdictions (USA, Canada, Australia), with tight screening criteria including pure gold assets, 0.5–5.0 Moz scale, arm’s-length deals, and publicly disclosed resources. That gives us 14 clean transactions from 2010 to present.
This matters because producer-level M&A tells a different story. There are signs that premiums for operating mines are recovering in 2025. But pre-production assets — ounces still in the ground — haven’t followed. The market is re-pricing cash flow but not re-pricing discovery. That divergence is the Gold Gap.
The interactive chart is available at gilbertanalytics.github.io/gold-gap.
The Gold Gap Index is a macro market indicator, not a property-level valuation tool. It does not constitute investment advice. Full methodology published in GG-002.