
Gold Gap Snapshot — May 2026
Gold at $4,600. Acquirers still paying 14 cents on the dollar.

Acquirers paid a $93/oz median for pre-production gold in the ground. Five years of M&A data. Eleven deals.
At $4,614 gold (Friday’s close), the margin-justified benchmark is $644/oz.
The gap between those two numbers: $551/oz. That’s 86% compression.
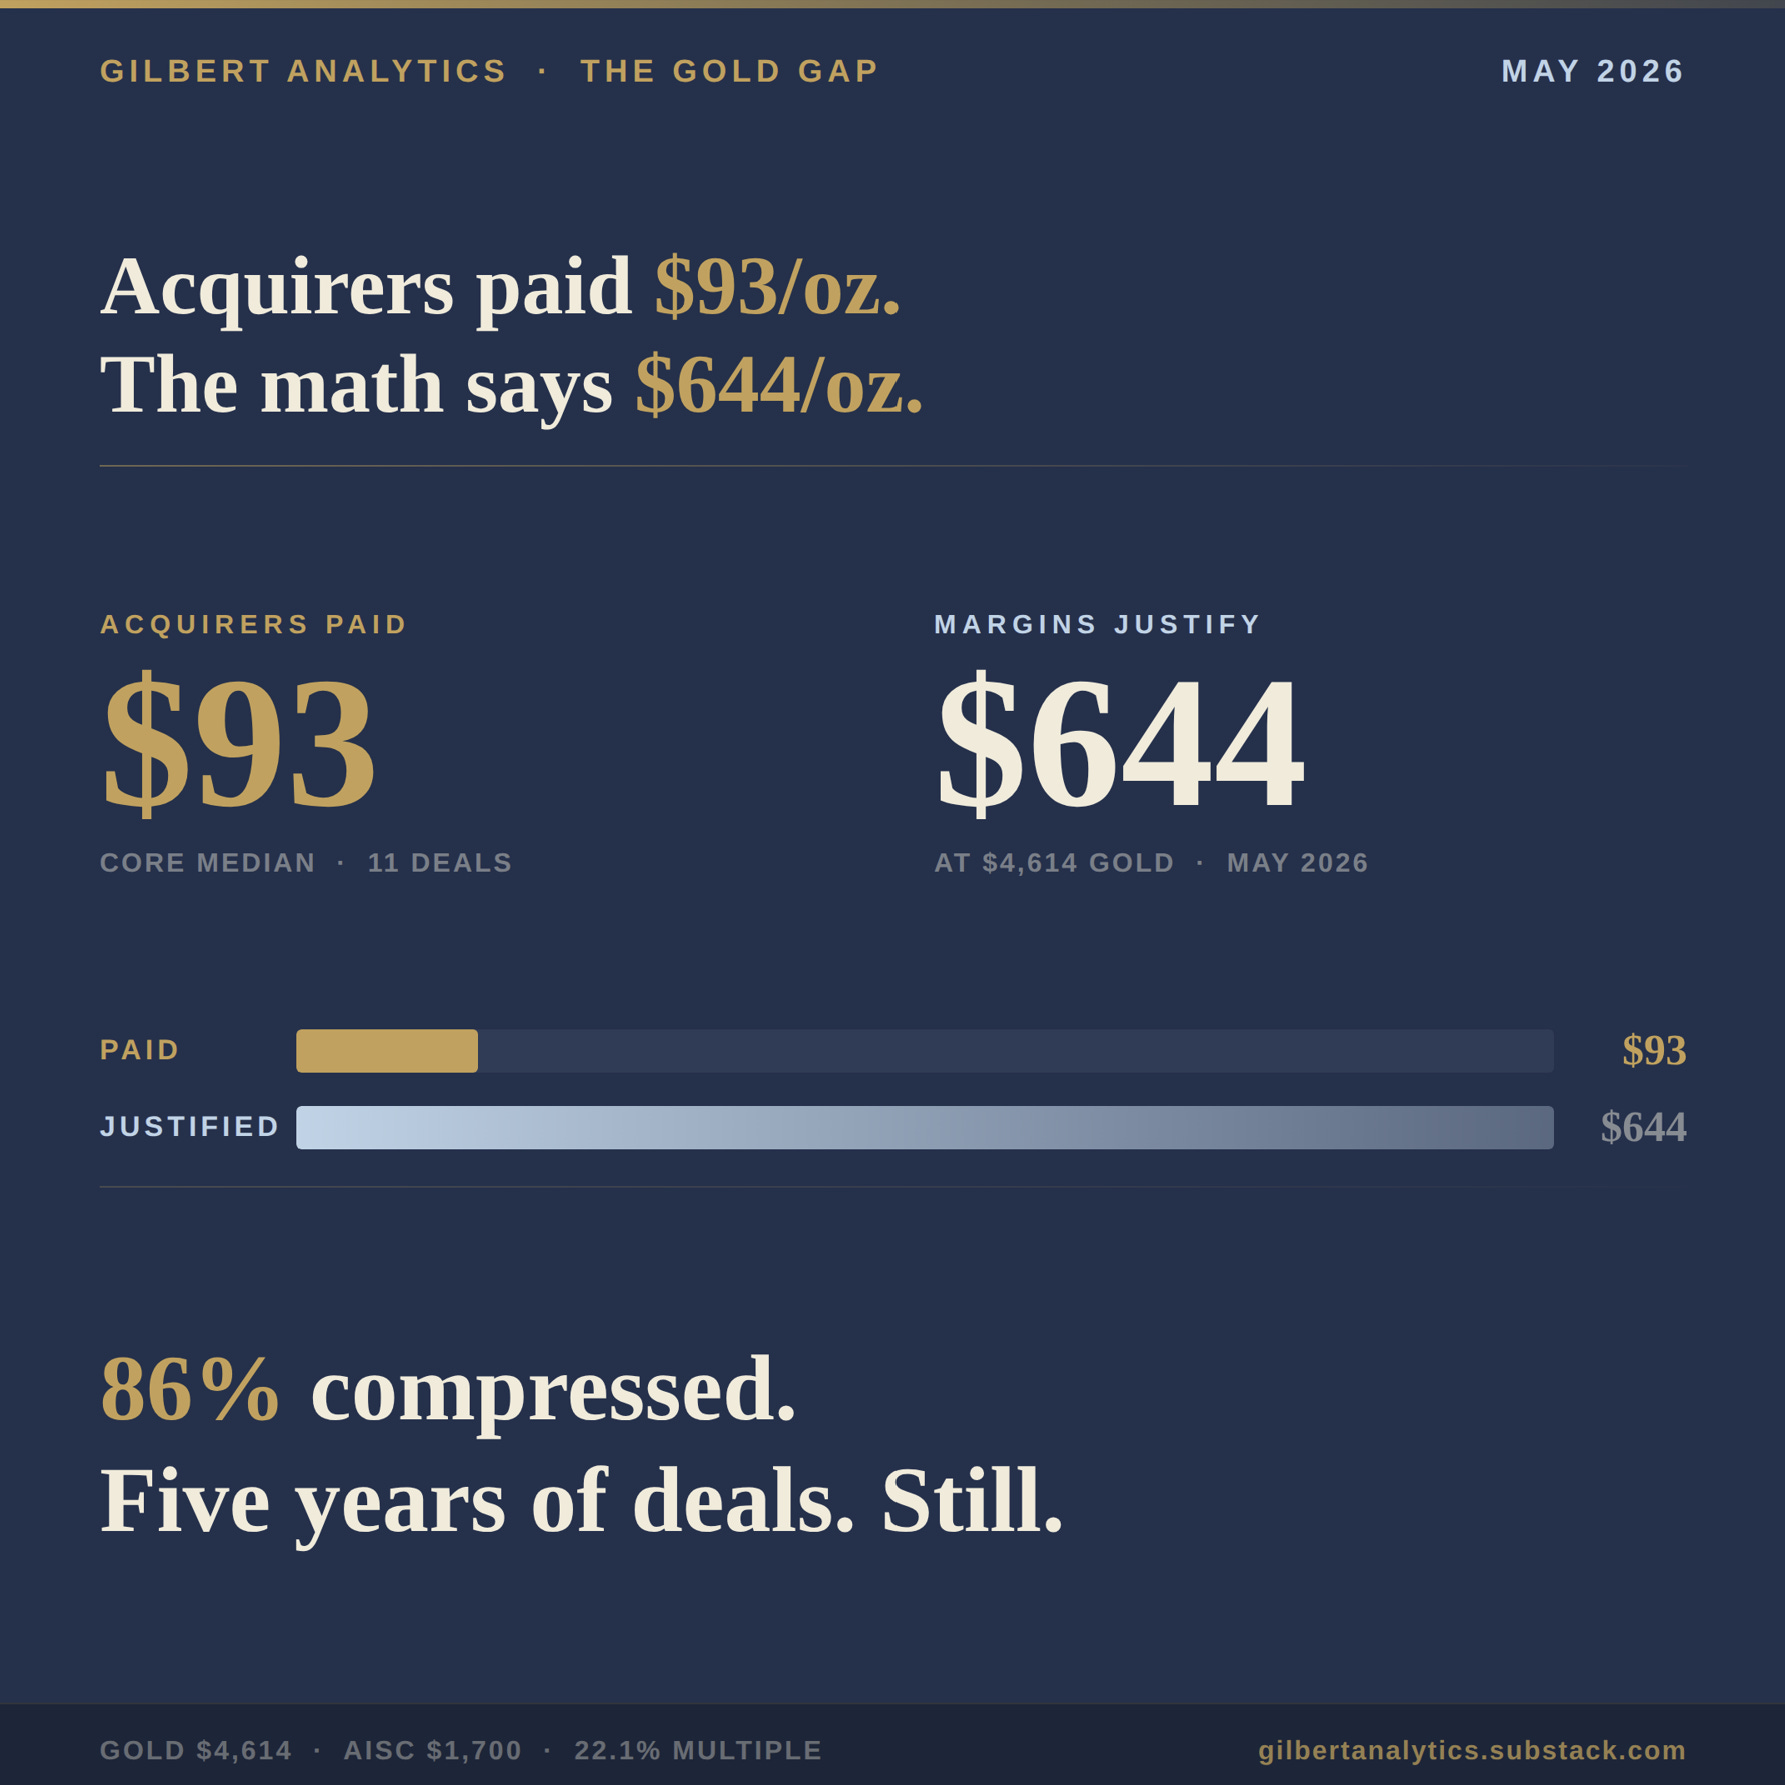
This is what the Gold Gap measures: not whether gold went up or down, but whether the re-rating of pre-production ounces ever followed. In five years of M&A data across eleven transactions, it hasn't.
The benchmark moves with spot. The Core Median doesn’t. That asymmetry is the thesis.
The Gold Grid tracks which pre-production companies are best positioned when that gap starts to close.
See the full interactive chart: gilbertanalytics.substack.com
What closes the gap first: M&A pricing rising to meet the benchmark, or a discovery cycle scarce enough to force re-rating from the bottom up?
Gilbert Analytics | Not Investment Advice | Alain Gilbert, B.Eng.
Full disclosures at gilbertanalytics.substack.com/about